Note
This is the documentation for the current state of the development branch of Qiskit Experiments. The documentation or APIs here can change prior to being released.
Quantum State Tomography
Quantum tomography is an experimental procedure to reconstruct a description of part of a quantum system from the measurement outcomes of a specific set of experiments. In particular, quantum state tomography reconstructs the density matrix of a quantum state by preparing the state many times and measuring them in a tomographically complete basis of measurement operators.
Note
This tutorial requires the qiskit-aer and qiskit-ibm-runtime
packages to run simulations. You can install them with python -m pip
install qiskit-aer qiskit-ibm-runtime.
We first initialize a simulator to run the experiments on.
from qiskit_aer import AerSimulator
from qiskit_ibm_runtime.fake_provider import FakePerth

backend = AerSimulator.from_backend(FakePerth())
To run a state tomography experiment, we initialize the experiment with a circuit to
prepare the state to be measured. We can also pass in an
Operator or a Statevector
to describe the preparation circuit.
import qiskit
from qiskit_experiments.framework import ParallelExperiment
from qiskit_experiments.library import StateTomography

# GHZ State preparation circuit
nq = 2
qc_ghz = qiskit.QuantumCircuit(nq)
qc_ghz.h(0)
qc_ghz.s(0)
for i in range(1, nq):
    qc_ghz.cx(0, i)

# QST Experiment
qstexp1 = StateTomography(qc_ghz)
qstdata1 = qstexp1.run(backend, seed_simulation=100).block_for_results()

# Print results
display(qstdata1.analysis_results(dataframe=True))
| name | experiment | components | value | quality | backend | run_time | trace | eigvals | raw_eigvals | rescaled_psd | fitter_metadata | conditional_probability | positive | |
|---|---|---|---|---|---|---|---|---|---|---|---|---|---|---|
| 9f63a1a5 | state | StateTomography | [Q0, Q1] | DensityMatrix([[ 0.47981771+0.00000000e+00j, ... | unknown | aer_simulator_from(fake_perth) | None | 1.0 | [0.9080500690345505, 0.04246724209673139, 0.03... | [0.9080500690345505, 0.04246724209673139, 0.03... | False | {'fitter': 'linear_inversion', 'fitter_time': ... | 1.0 | True |
| 6312a808 | state_fidelity | StateTomography | [Q0, Q1] | 0.907715 | unknown | aer_simulator_from(fake_perth) | None | None | None | None | None | None | None | None |
| e52cdf45 | positive | StateTomography | [Q0, Q1] | True | unknown | aer_simulator_from(fake_perth) | None | None | None | None | None | None | None | None |
Tomography Results
The main result for tomography is the fitted state, which is stored as a
DensityMatrix object:
state_result = qstdata1.analysis_results("state", dataframe=True).iloc[0]
print(state_result.value)
DensityMatrix([[ 0.47981771+0.00000000e+00j,  0.00260417-6.34765625e-03j,
                 0.01074219+1.04083409e-17j, -0.00585938-4.36035156e-01j],
               [ 0.00260417+6.34765625e-03j,  0.02408854+0.00000000e+00j,
                -0.00683594+4.88281250e-04j,  0.00097656+5.85937500e-03j],
               [ 0.01074219-1.04083409e-17j, -0.00683594-4.88281250e-04j,
                 0.03255208+0.00000000e+00j,  0.00553385-6.34765625e-03j],
               [-0.00585938+4.36035156e-01j,  0.00097656-5.85937500e-03j,
                 0.00553385+6.34765625e-03j,  0.46354167+0.00000000e+00j]],
              dims=(2, 2))
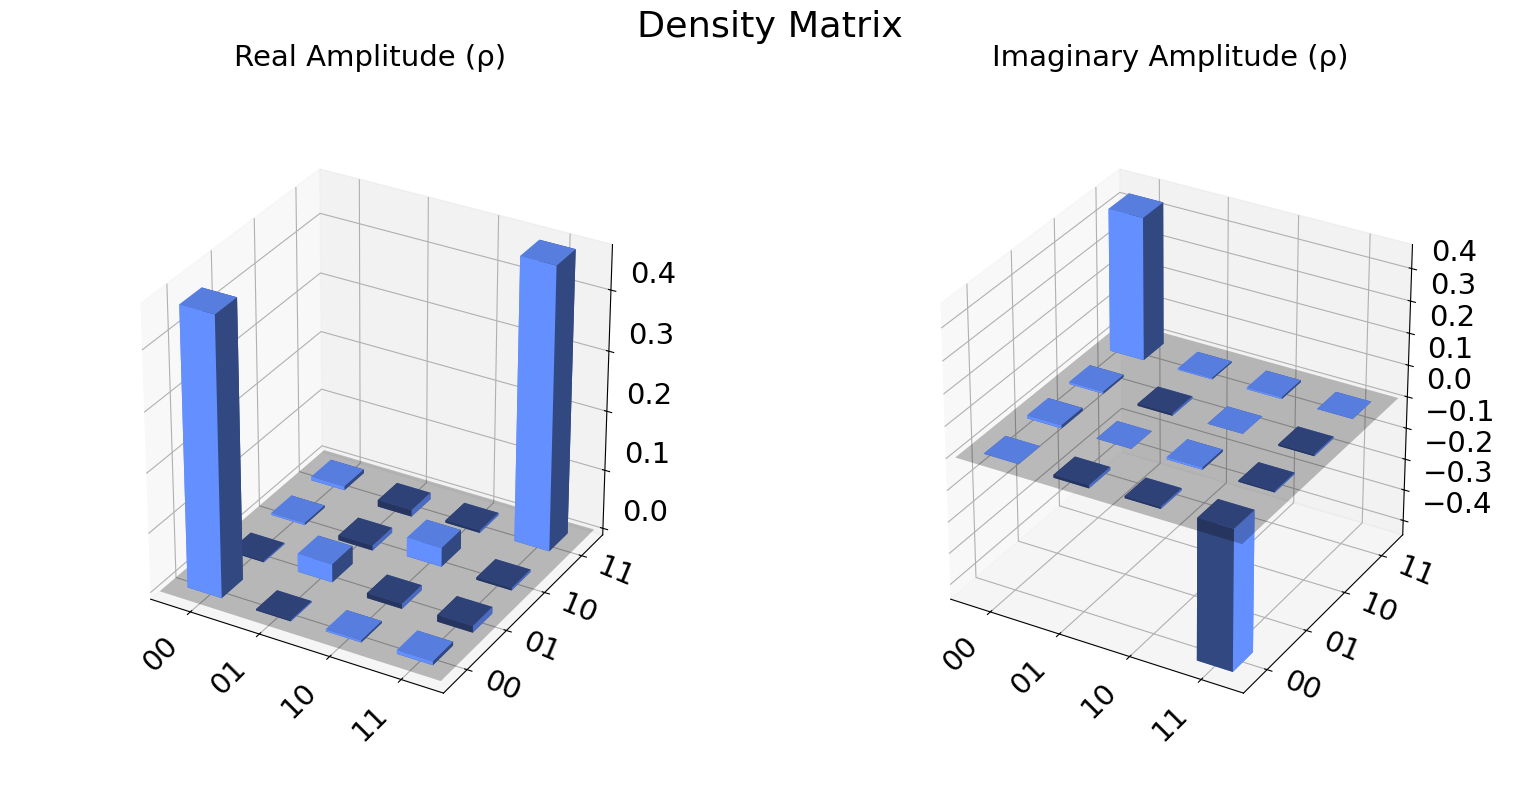
We can also visualize the density matrix:
from qiskit.visualization import plot_state_city
state = qstdata1.analysis_results("state", dataframe=True).iloc[0].value
plot_state_city(state, title='Density Matrix')
The state fidelity of the fitted state with the ideal state prepared by
the input circuit is stored in the "state_fidelity" result field.
Note that if the input circuit contained any measurements the ideal
state cannot be automatically generated and this field will be set to
None.
fid_result = qstdata1.analysis_results("state_fidelity", dataframe=True).iloc[0]
print("State Fidelity = {:.5f}".format(fid_result.value))
State Fidelity = 0.90771
Additional state metadata
Additional data is stored in the tomography under additional fields. This includes
eigvals: the eigenvalues of the fitted statetrace: the trace of the fitted statepositive: Whether the eigenvalues are all non-negative
If trace rescaling was performed this dictionary will also contain a raw_trace field
containing the trace before rescaling. Futhermore, if the state was rescaled to be
positive or trace 1 an additional field raw_eigvals will contain the state
eigenvalues before rescaling was performed.
for col in ["eigvals", "trace", "positive"]:
    print(f"{col}: {state_result[col]}")
eigvals: [0.90805007 0.04246724 0.03203525 0.01744744]
trace: 1.000000000000002
positive: True
To see the effect of rescaling, we can perform a “bad” fit with very low counts:
# QST Experiment
bad_data = qstexp1.run(backend, shots=10, seed_simulation=100).block_for_results()
bad_state_result = bad_data.analysis_results("state", dataframe=True).iloc[0]

# Print result
for key, val in bad_state_result.items():
    print(f"{key}: {val}")
name: state
experiment: StateTomography
components: [<Qubit(Q0)>, <Qubit(Q1)>]
value: DensityMatrix([[ 0.39205314+0.00000000e+00j,  0.00867679+4.22588724e-03j,
                 0.10061954-1.97839192e-02j, -0.03414422-3.41243895e-01j],
               [ 0.00867679-4.22588724e-03j,  0.14459046+0.00000000e+00j,
                 0.0663786 -5.30914311e-02j, -0.05858122-6.34844716e-02j],
               [ 0.10061954+1.97839192e-02j,  0.0663786 +5.30914311e-02j,
                 0.08991156+8.67361738e-19j,  0.01509177-1.14149897e-01j],
               [-0.03414422+3.41243895e-01j, -0.05858122+6.34844716e-02j,
                 0.01509177+1.14149897e-01j,  0.37344483+6.93889390e-18j]],
              dims=(2, 2))
quality: unknown
backend: aer_simulator_from(fake_perth)
run_time: None
trace: 1.0000000000000058
eigvals: [0.77258289 0.19034853 0.03706858 0.        ]
raw_eigvals: [ 0.85139893  0.26916457  0.11588462 -0.23644812]
rescaled_psd: True
fitter_metadata: {'fitter': 'linear_inversion', 'fitter_time': 0.002925872802734375}
conditional_probability: 1.0
positive: True
Tomography Fitters
The default fitters is linear_inversion, which reconstructs the
state using dual basis of the tomography basis. This will typically
result in a non-positive reconstructed state. This state is rescaled to
be positive-semidefinite (PSD) by computing its eigen-decomposition and
rescaling its eigenvalues using the approach from Ref. [1].
There are several other fitters are included (See API documentation for
details). For example, if cvxpy is installed we can use the
cvxpy_gaussian_lstsq() fitter, which allows constraining the fit to be
PSD without requiring rescaling.
try:
    import cvxpy

    # Set analysis option for cvxpy fitter
    qstexp1.analysis.set_options(fitter='cvxpy_gaussian_lstsq')

    # Re-run experiment
    qstdata2 = qstexp1.run(backend, seed_simulation=100).block_for_results()

    state_result2 = qstdata2.analysis_results("state", dataframe=True).iloc[0]
    for key, val in state_result2.items():
        print(f"{key}: {val}")

except ModuleNotFoundError:
    print("CVXPY is not installed")
name: state
experiment: StateTomography
components: [<Qubit(Q0)>, <Qubit(Q1)>]
value: DensityMatrix([[ 0.46932424+0.00000000e+00j, -0.0302239 +8.13133541e-03j,
                 0.02283738+2.36497207e-03j,  0.0111301 -4.43339330e-01j],
               [-0.0302239 -8.13133541e-03j,  0.02683879+0.00000000e+00j,
                -0.00303983+1.58215262e-03j, -0.01465418+5.31327627e-05j],
               [ 0.02283738-2.36497207e-03j, -0.00303983-1.58215262e-03j,
                 0.03006746+0.00000000e+00j,  0.015547  -4.29245760e-03j],
               [ 0.0111301 +4.43339330e-01j, -0.01465418-5.31327627e-05j,
                 0.015547  +4.29245760e-03j,  0.47376951+0.00000000e+00j]],
              dims=(2, 2))
quality: unknown
backend: aer_simulator_from(fake_perth)
run_time: None
trace: 0.9999999996322728
eigvals: [9.16376923e-01 5.66122411e-02 2.70106363e-02 1.99860670e-07]
raw_eigvals: [9.16376923e-01 5.66122412e-02 2.70106363e-02 1.99860670e-07]
rescaled_psd: False
fitter_metadata: {'fitter': 'cvxpy_gaussian_lstsq', 'cvxpy_solver': 'SCS', 'cvxpy_status': ['optimal'], 'psd_constraint': True, 'trace_preserving': True, 'fitter_time': 0.037568092346191406}
conditional_probability: 1.0
positive: True
Parallel Tomography Experiment
We can also use the ParallelExperiment class to
run subsystem tomography on multiple qubits in parallel.
For example if we want to perform 1-qubit QST on several qubits at once:
from math import pi
num_qubits = 5
gates = [qiskit.circuit.library.RXGate(i * pi / (num_qubits - 1))
         for i in range(num_qubits)]

subexps = [
    StateTomography(gate, physical_qubits=(i,))
    for i, gate in enumerate(gates)
]
parexp = ParallelExperiment(subexps)
pardata = parexp.run(backend, seed_simulation=100).block_for_results()

display(pardata.analysis_results(dataframe=True))
| name | experiment | components | value | quality | backend | run_time | trace | eigvals | raw_eigvals | rescaled_psd | fitter_metadata | conditional_probability | positive | |
|---|---|---|---|---|---|---|---|---|---|---|---|---|---|---|
| 075691f3 | state | StateTomography | [Q0] | DensityMatrix([[ 0.97167969+0.j , -0.00... | unknown | aer_simulator_from(fake_perth) | None | 1.0 | [0.9717656090867501, 0.02823439091325094] | [0.9717656090867501, 0.02823439091325094] | False | {'fitter': 'linear_inversion', 'fitter_time': ... | 1.0 | True |
| 609b8ebe | state_fidelity | StateTomography | [Q0] | 0.97168 | unknown | aer_simulator_from(fake_perth) | None | None | None | None | None | None | None | None |
| 97b22c21 | positive | StateTomography | [Q0] | True | unknown | aer_simulator_from(fake_perth) | None | None | None | None | None | None | None | None |
| 2e562afe | state | StateTomography | [Q1] | DensityMatrix([[ 0.82324219+0.j , -0.00... | unknown | aer_simulator_from(fake_perth) | None | 1.0 | [0.9655028727081199, 0.03449712729188127] | [0.9655028727081199, 0.03449712729188127] | False | {'fitter': 'linear_inversion', 'fitter_time': ... | 1.0 | True |
| 41c0f2e9 | state_fidelity | StateTomography | [Q1] | 0.96542 | unknown | aer_simulator_from(fake_perth) | None | None | None | None | None | None | None | None |
| 44e1c15a | positive | StateTomography | [Q1] | True | unknown | aer_simulator_from(fake_perth) | None | None | None | None | None | None | None | None |
| 4c1321ef | state | StateTomography | [Q2] | DensityMatrix([[ 0.49316406+0.j , -0.01... | unknown | aer_simulator_from(fake_perth) | None | 1.0 | [0.9679956087737827, 0.032004391226218176] | [0.9679956087737827, 0.032004391226218176] | False | {'fitter': 'linear_inversion', 'fitter_time': ... | 1.0 | True |
| 36495e9d | state_fidelity | StateTomography | [Q2] | 0.967773 | unknown | aer_simulator_from(fake_perth) | None | None | None | None | None | None | None | None |
| eaa8c6ff | positive | StateTomography | [Q2] | True | unknown | aer_simulator_from(fake_perth) | None | None | None | None | None | None | None | None |
| e3dfe378 | state | StateTomography | [Q3] | DensityMatrix([[ 0.16503906+0.j , -0.01... | unknown | aer_simulator_from(fake_perth) | None | 1.0 | [0.9738280847459797, 0.02617191525402135] | [0.9738280847459797, 0.02617191525402135] | False | {'fitter': 'linear_inversion', 'fitter_time': ... | 1.0 | True |
| 58251127 | state_fidelity | StateTomography | [Q3] | 0.973706 | unknown | aer_simulator_from(fake_perth) | None | None | None | None | None | None | None | None |
| f4cc740f | positive | StateTomography | [Q3] | True | unknown | aer_simulator_from(fake_perth) | None | None | None | None | None | None | None | None |
| 32980899 | state | StateTomography | [Q4] | DensityMatrix([[ 0.02929688+0.j , -0.00... | unknown | aer_simulator_from(fake_perth) | None | 1.0 | [0.9707780833728133, 0.02922191662718756] | [0.9707780833728133, 0.02922191662718756] | False | {'fitter': 'linear_inversion', 'fitter_time': ... | 1.0 | True |
| 49901636 | state_fidelity | StateTomography | [Q4] | 0.970703 | unknown | aer_simulator_from(fake_perth) | None | None | None | None | None | None | None | None |
| c6a5907d | positive | StateTomography | [Q4] | True | unknown | aer_simulator_from(fake_perth) | None | None | None | None | None | None | None | None |
View experiment analysis results for one component:
results = pardata.analysis_results(dataframe=True)
display(results[results.components.apply(lambda x: x == ["Q0"])])
| name | experiment | components | value | quality | backend | run_time | trace | eigvals | raw_eigvals | rescaled_psd | fitter_metadata | conditional_probability | positive | |
|---|---|---|---|---|---|---|---|---|---|---|---|---|---|---|
| 075691f3 | state | StateTomography | [Q0] | DensityMatrix([[ 0.97167969+0.j , -0.00... | unknown | aer_simulator_from(fake_perth) | None | 1.0 | [0.9717656090867501, 0.02823439091325094] | [0.9717656090867501, 0.02823439091325094] | False | {'fitter': 'linear_inversion', 'fitter_time': ... | 1.0 | True |
| 609b8ebe | state_fidelity | StateTomography | [Q0] | 0.97168 | unknown | aer_simulator_from(fake_perth) | None | None | None | None | None | None | None | None |
| 97b22c21 | positive | StateTomography | [Q0] | True | unknown | aer_simulator_from(fake_perth) | None | None | None | None | None | None | None | None |
References
See also
API documentation:
StateTomography