Note
This is the documentation for the current state of the development branch of Qiskit Experiments. The documentation or APIs here can change prior to being released.
Work with experiment artifacts
Problem
You want to view, add, remove, and save artifacts associated with your ExperimentData instance.
Solution
Artifacts are used to store auxiliary data for an experiment that don’t fit neatly in the
AnalysisResult model. Any data that can be serialized, such as fit data, can be added as
ArtifactData artifacts to ExperimentData.
For example, after an experiment that uses CurveAnalysis is run, its ExperimentData
object is automatically populated with fit_summary and curve_data artifacts. The fit_summary
artifact has one or more CurveFitResult objects that contain parameters from the fit. The
curve_data artifact has a ScatterTable object that contains raw and fitted data in a pandas
DataFrame.
Viewing artifacts
Here we run a parallel experiment consisting of two T1 experiments in parallel and then view the output
artifacts as a list of ArtifactData objects accessed by ExperimentData.artifacts():
from qiskit_ibm_runtime.fake_provider import FakePerth
from qiskit_aer import AerSimulator
from qiskit_experiments.library import T1
from qiskit_experiments.framework import ParallelExperiment
import numpy as np

backend = AerSimulator.from_backend(FakePerth())
exp1 = T1(physical_qubits=[0], delays=np.arange(1e-6, 6e-4, 5e-5))
exp2 = T1(physical_qubits=[1], delays=np.arange(1e-6, 6e-4, 5e-5))
data = ParallelExperiment([exp1, exp2]).run(backend).block_for_results()
data.artifacts()
[ArtifactData(name=curve_data, dtype=ScatterTable, uid=b7639f0f-b341-43cc-935f-10917ba966ca, experiment=T1, device_components=[<Qubit(Q0)>]),
 ArtifactData(name=fit_summary, dtype=CurveFitResult, uid=8fe7561c-30e5-4e2c-8a53-045b94dae8fc, experiment=T1, device_components=[<Qubit(Q0)>]),
 ArtifactData(name=curve_data, dtype=ScatterTable, uid=6116ea2c-70bb-40d0-b26f-5dc2fcce645e, experiment=T1, device_components=[<Qubit(Q1)>]),
 ArtifactData(name=fit_summary, dtype=CurveFitResult, uid=aa706232-2d8a-43f7-b311-b66f38d415c4, experiment=T1, device_components=[<Qubit(Q1)>])]
Artifacts can be accessed using either the artifact ID, which has to be unique in each
ExperimentData object, or the artifact name, which does not have to be unique and will return
all artifacts with the same name:
print("Number of curve_data artifacts:", len(data.artifacts("curve_data")))
# retrieve by name and index
curve_data_id = data.artifacts("curve_data")[0].artifact_id
# retrieve by ID
scatter_table = data.artifacts(curve_data_id).data
print("The first curve_data artifact:\n")
scatter_table.dataframe
Number of curve_data artifacts: 2
The first curve_data artifact:
| xval | yval | yerr | series_name | series_id | category | shots | analysis | |
|---|---|---|---|---|---|---|---|---|
| 0 | 0.000001 | 0.954634 | 0.006497 | exp_decay | 0 | raw | 1024 | T1Analysis |
| 1 | 0.000051 | 0.434634 | 0.015476 | exp_decay | 0 | raw | 1024 | T1Analysis |
| 2 | 0.000101 | 0.172195 | 0.011787 | exp_decay | 0 | raw | 1024 | T1Analysis |
| 3 | 0.000151 | 0.106829 | 0.009644 | exp_decay | 0 | raw | 1024 | T1Analysis |
| 4 | 0.000201 | 0.065854 | 0.007743 | exp_decay | 0 | raw | 1024 | T1Analysis |
| ... | ... | ... | ... | ... | ... | ... | ... | ... |
| 119 | 0.000529 | 0.026007 | 0.002041 | exp_decay | 0 | fitted | <NA> | T1Analysis |
| 120 | 0.000534 | 0.025996 | 0.002042 | exp_decay | 0 | fitted | <NA> | T1Analysis |
| 121 | 0.00054 | 0.025987 | 0.002043 | exp_decay | 0 | fitted | <NA> | T1Analysis |
| 122 | 0.000545 | 0.025979 | 0.002044 | exp_decay | 0 | fitted | <NA> | T1Analysis |
| 123 | 0.000551 | 0.025971 | 0.002045 | exp_decay | 0 | fitted | <NA> | T1Analysis |
124 rows × 8 columns
In composite experiments, artifacts behave like analysis results and figures in that if
flatten_results isn’t True, they are accessible in the artifacts() method of each
child_data(). The artifacts in a large composite experiment with flatten_results=True can be
distinguished from each other using the experiment and
device_components
attributes.
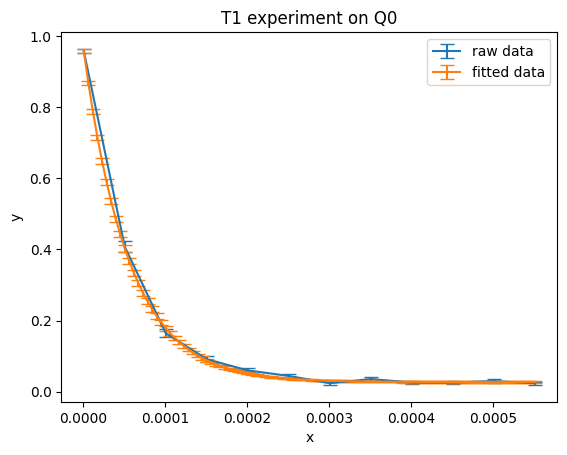
One useful pattern is to load raw or fitted data from curve_data for further data manipulation. You
can work with the dataframe using standard pandas dataframe methods or the built-in
ScatterTable methods:
import matplotlib.pyplot as plt

exp_type = data.artifacts(curve_data_id).experiment
component = data.artifacts(curve_data_id).device_components[0]

raw_data = scatter_table.filter(category="raw")
fitted_data = scatter_table.filter(category="fitted")

# visualize the data
plt.figure()
plt.errorbar(raw_data.x, raw_data.y, yerr=raw_data.y_err, capsize=5, label="raw data")
plt.errorbar(fitted_data.x, fitted_data.y, yerr=fitted_data.y_err, capsize=5, label="fitted data")
plt.title(f"{exp_type} experiment on {component}")
plt.xlabel('x')
plt.ylabel('y')
plt.legend()
plt.show()

Adding artifacts
You can add arbitrary data as an artifact as long as it’s serializable with ExperimentEncoder,
which extends Python’s default JSON serialization with support for other data types commonly used with
Qiskit Experiments.
from qiskit_experiments.framework import ArtifactData

new_artifact = ArtifactData(name="experiment_notes", data={"content": "Testing some new ideas."})
data.add_artifacts(new_artifact)
data.artifacts("experiment_notes")
ArtifactData(name=experiment_notes, dtype=dict, uid=70ea64a4-c8d0-4fda-a454-437d566a26a4, experiment=None, device_components=[])
print(data.artifacts("experiment_notes").data)
{'content': 'Testing some new ideas.'}
Saving and loading artifacts
Note
This feature is only for those who have access to the cloud service. You can check whether you do by logging into the IBM Quantum interface and seeing if you can see the database.
Artifacts are saved and loaded to and from the cloud service along with the rest of the
ExperimentData object. Artifacts are stored as .zip files in the cloud service grouped by
the artifact name. For example, the composite experiment above will generate two artifact files, fit_summary.zip and
curve_data.zip. Each of these zipfiles will contain serialized artifact data in JSON format named
by their unique artifact ID:
fit_summary.zip
|- 8fe7561c-30e5-4e2c-8a53-045b94dae8fc.json
|- aa706232-2d8a-43f7-b311-b66f38d415c4.json
curve_data.zip
|- b7639f0f-b341-43cc-935f-10917ba966ca.json
|- 6116ea2c-70bb-40d0-b26f-5dc2fcce645e.json
experiment_notes.zip
|- 70ea64a4-c8d0-4fda-a454-437d566a26a4.json
Note that for performance reasons, the auto save feature does not apply to artifacts. You must still
call ExperimentData.save() once the experiment analysis has completed to upload artifacts to the
cloud service.
Note also though individual artifacts can be deleted, currently artifact files cannot be removed from the
cloud service. Instead, you can delete all artifacts of that name
using delete_artifact() and then call ExperimentData.save().
This will save an empty file to the service, and the loaded experiment data will not contain
these artifacts.
See Also
ArtifactDataAPI documentationScatterTableAPI documentationCurveFitResultAPI documentation