Quantum State Tomography
Quantum tomography is an experimental procedure to reconstruct a description of part of a quantum system from the measurement outcomes of a specific set of experiments. In particular, quantum state tomography reconstructs the density matrix of a quantum state by preparing the state many times and measuring them in a tomographically complete basis of measurement operators.
Note
This tutorial requires the qiskit-aer and qiskit-ibm-runtime
packages to run simulations. You can install them with python -m pip
install qiskit-aer qiskit-ibm-runtime.
We first initialize a simulator to run the experiments on.
from qiskit_aer import AerSimulator
from qiskit_ibm_runtime.fake_provider import FakePerth

backend = AerSimulator.from_backend(FakePerth())
To run a state tomography experiment, we initialize the experiment with a circuit to
prepare the state to be measured. We can also pass in an
Operator or a Statevector
to describe the preparation circuit.
import qiskit
from qiskit_experiments.framework import ParallelExperiment
from qiskit_experiments.library import StateTomography

# GHZ State preparation circuit
nq = 2
qc_ghz = qiskit.QuantumCircuit(nq)
qc_ghz.h(0)
qc_ghz.s(0)
for i in range(1, nq):
    qc_ghz.cx(0, i)

# QST Experiment
qstexp1 = StateTomography(qc_ghz)
qstdata1 = qstexp1.run(backend, seed_simulation=100).block_for_results()

# Print results
display(qstdata1.analysis_results(dataframe=True))
| name | experiment | components | value | quality | backend | run_time | trace | eigvals | raw_eigvals | rescaled_psd | fitter_metadata | conditional_probability | positive | |
|---|---|---|---|---|---|---|---|---|---|---|---|---|---|---|
| 22db9e0b | state | StateTomography | [Q0, Q1] | DensityMatrix([[ 0.46402995+0.j , 0.01... | None | aer_simulator_from(fake_perth) | None | 1.0 | [0.9232184110521847, 0.040218685699838067, 0.0... | [0.9232184110521847, 0.040218685699838067, 0.0... | False | {'fitter': 'linear_inversion', 'fitter_time': ... | 1.0 | True |
| 4a4345a2 | state_fidelity | StateTomography | [Q0, Q1] | 0.922852 | None | aer_simulator_from(fake_perth) | None | None | None | None | None | None | None | None |
| 834aab80 | positive | StateTomography | [Q0, Q1] | True | None | aer_simulator_from(fake_perth) | None | None | None | None | None | None | None | None |
Tomography Results
The main result for tomography is the fitted state, which is stored as a
DensityMatrix object:
state_result = qstdata1.analysis_results("state", dataframe=True).iloc[0]
print(state_result.value)
DensityMatrix([[ 0.46402995+0.j        ,  0.01009115+0.00146484j,
                 0.00585938-0.00048828j,  0.00341797-0.44726562j],
               [ 0.01009115-0.00146484j,  0.02099609+0.j        ,
                -0.00634766+0.00390625j,  0.00683594-0.00048828j],
               [ 0.00585938+0.00048828j, -0.00634766-0.00390625j,
                 0.02783203+0.j        , -0.01041667-0.00537109j],
               [ 0.00341797+0.44726562j,  0.00683594+0.00048828j,
                -0.01041667+0.00537109j,  0.48714193+0.j        ]],
              dims=(2, 2))
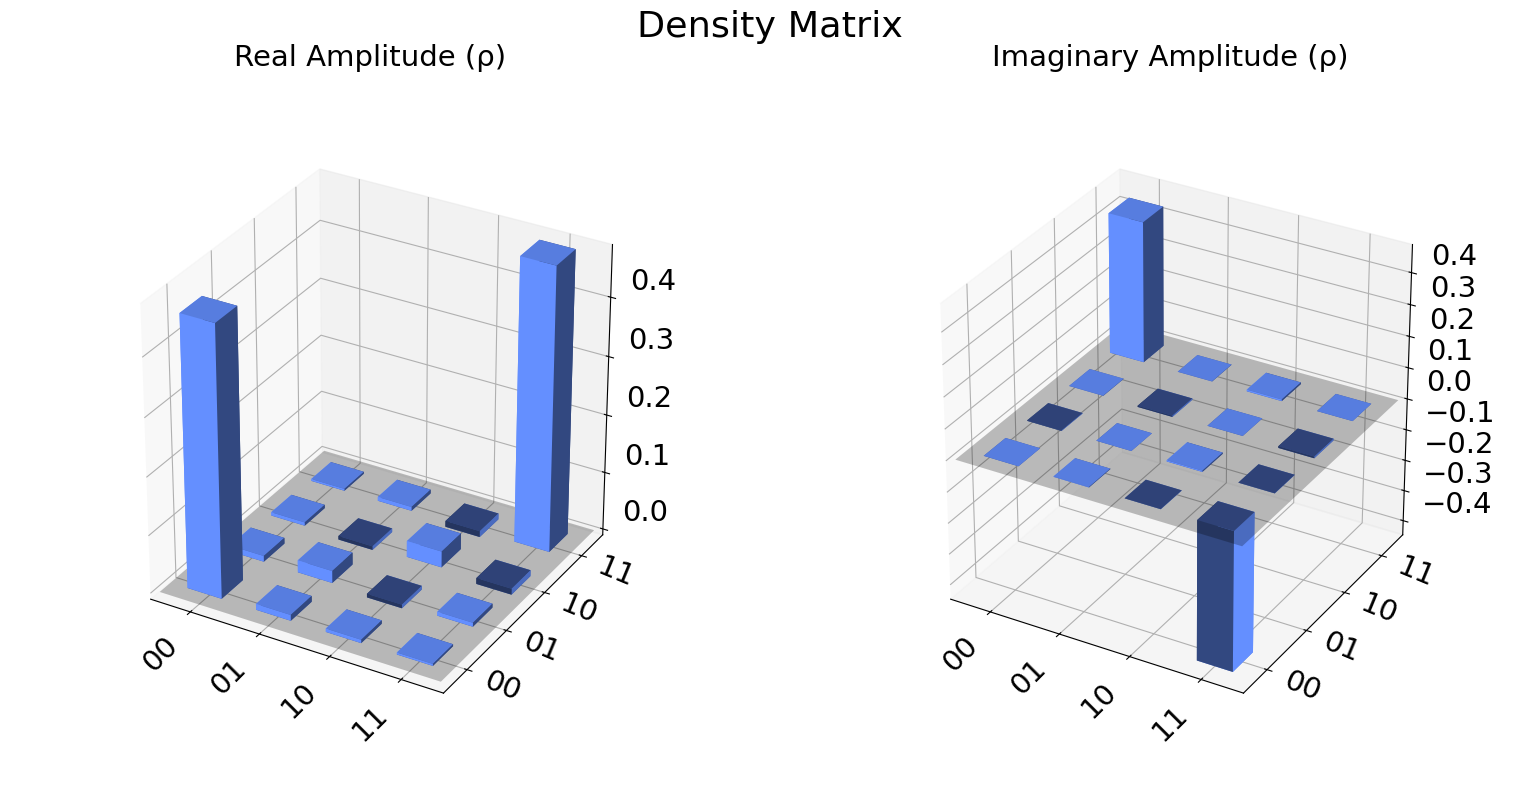
We can also visualize the density matrix:
from qiskit.visualization import plot_state_city
state = qstdata1.analysis_results("state", dataframe=True).iloc[0].value
plot_state_city(state, title='Density Matrix')
The state fidelity of the fitted state with the ideal state prepared by
the input circuit is stored in the "state_fidelity" result field.
Note that if the input circuit contained any measurements the ideal
state cannot be automatically generated and this field will be set to
None.
fid_result = qstdata1.analysis_results("state_fidelity", dataframe=True).iloc[0]
print("State Fidelity = {:.5f}".format(fid_result.value))
State Fidelity = 0.92285
Additional state metadata
Additional data is stored in the tomography under additional fields. This includes
eigvals: the eigenvalues of the fitted statetrace: the trace of the fitted statepositive: Whether the eigenvalues are all non-negative
If trace rescaling was performed this dictionary will also contain a raw_trace field
containing the trace before rescaling. Futhermore, if the state was rescaled to be
positive or trace 1 an additional field raw_eigvals will contain the state
eigenvalues before rescaling was performed.
for col in ["eigvals", "trace", "positive"]:
    print(f"{col}: {state_result[col]}")
eigvals: [0.92321841 0.04021869 0.02540878 0.01115412]
trace: 1.0000000000000016
positive: True
To see the effect of rescaling, we can perform a “bad” fit with very low counts:
# QST Experiment
bad_data = qstexp1.run(backend, shots=10, seed_simulation=100).block_for_results()
bad_state_result = bad_data.analysis_results("state", dataframe=True).iloc[0]

# Print result
for key, val in bad_state_result.items():
    print(f"{key}: {val}")
name: state
experiment: StateTomography
components: [<Qubit(Q0)>, <Qubit(Q1)>]
value: DensityMatrix([[ 0.37627465+0.00000000e+00j,  0.02157191+5.64191167e-02j,
                -0.03899897+1.54252344e-03j,  0.05005565-3.18700586e-01j],
               [ 0.02157191-5.64191167e-02j,  0.06820753+0.00000000e+00j,
                -0.07860112+1.95737053e-02j,  0.05476927-1.61358157e-02j],
               [-0.03899897-1.54252344e-03j, -0.07860112-1.95737053e-02j,
                 0.10749896-1.73472348e-18j, -0.13474549-3.02879271e-03j],
               [ 0.05005565+3.18700586e-01j,  0.05476927+1.61358157e-02j,
                -0.13474549+3.02879271e-03j,  0.44801885+0.00000000e+00j]],
              dims=(2, 2))
quality: None
backend: aer_simulator_from(fake_perth)
run_time: None
trace: 1.0000000000000049
eigvals: [0.75785678 0.24214322 0.         0.        ]
raw_eigvals: [ 0.87957154  0.36385799  0.02338879 -0.26681831]
rescaled_psd: True
fitter_metadata: {'fitter': 'linear_inversion', 'fitter_time': 0.0030813217163085938}
conditional_probability: 1.0
positive: True
Tomography Fitters
The default fitters is linear_inversion, which reconstructs the
state using dual basis of the tomography basis. This will typically
result in a non-positive reconstructed state. This state is rescaled to
be positive-semidefinite (PSD) by computing its eigen-decomposition and
rescaling its eigenvalues using the approach from Ref. [1].
There are several other fitters are included (See API documentation for
details). For example, if cvxpy is installed we can use the
cvxpy_gaussian_lstsq() fitter, which allows constraining the fit to be
PSD without requiring rescaling.
try:
    import cvxpy

    # Set analysis option for cvxpy fitter
    qstexp1.analysis.set_options(fitter='cvxpy_gaussian_lstsq')

    # Re-run experiment
    qstdata2 = qstexp1.run(backend, seed_simulation=100).block_for_results()

    state_result2 = qstdata2.analysis_results("state", dataframe=True).iloc[0]
    for key, val in state_result2.items():
        print(f"{key}: {val}")

except ModuleNotFoundError:
    print("CVXPY is not installed")
name: state
experiment: StateTomography
components: [<Qubit(Q0)>, <Qubit(Q1)>]
value: DensityMatrix([[ 0.47445494+0.00000000e+00j,  0.00721187-1.63137999e-03j,
                 0.0016082 +4.44610456e-03j,  0.00382841-4.51088011e-01j],
               [ 0.00721187+1.63137999e-03j,  0.02641216+0.00000000e+00j,
                 0.00354996+1.66223627e-05j, -0.00527202-1.59171273e-03j],
               [ 0.0016082 -4.44610456e-03j,  0.00354996-1.66223627e-05j,
                 0.02909059+0.00000000e+00j, -0.01475184+1.64753599e-03j],
               [ 0.00382841+4.51088011e-01j, -0.00527202+1.59171273e-03j,
                -0.01475184-1.64753599e-03j,  0.47004231+0.00000000e+00j]],
              dims=(2, 2))
quality: None
backend: aer_simulator_from(fake_perth)
run_time: None
trace: 0.9999999996596667
eigvals: [0.92361404 0.03735279 0.02409327 0.01493991]
raw_eigvals: [0.92361404 0.03735279 0.02409327 0.01493991]
rescaled_psd: False
fitter_metadata: {'fitter': 'cvxpy_gaussian_lstsq', 'cvxpy_solver': 'SCS', 'cvxpy_status': ['optimal'], 'psd_constraint': True, 'trace_preserving': True, 'fitter_time': 0.03154611587524414}
conditional_probability: 1.0
positive: True
Parallel Tomography Experiment
We can also use the ParallelExperiment class to
run subsystem tomography on multiple qubits in parallel.
For example if we want to perform 1-qubit QST on several qubits at once:
from math import pi
num_qubits = 5
gates = [qiskit.circuit.library.RXGate(i * pi / (num_qubits - 1))
         for i in range(num_qubits)]

subexps = [
    StateTomography(gate, physical_qubits=(i,))
    for i, gate in enumerate(gates)
]
parexp = ParallelExperiment(subexps)
pardata = parexp.run(backend, seed_simulation=100).block_for_results()

display(pardata.analysis_results(dataframe=True))
| name | experiment | components | value | quality | backend | run_time | trace | eigvals | raw_eigvals | rescaled_psd | fitter_metadata | conditional_probability | positive | |
|---|---|---|---|---|---|---|---|---|---|---|---|---|---|---|
| 2aa691b6 | state | StateTomography | [Q0] | DensityMatrix([[0.97460938+0.j , 0.0078... | None | aer_simulator_from(fake_perth) | None | 1.0 | [0.974677689270737, 0.02532231072926413] | [0.974677689270737, 0.02532231072926413] | False | {'fitter': 'linear_inversion', 'fitter_time': ... | 1.0 | True |
| 32b73955 | state_fidelity | StateTomography | [Q0] | 0.974609 | None | aer_simulator_from(fake_perth) | None | None | None | None | None | None | None | None |
| 14d21b87 | positive | StateTomography | [Q0] | True | None | aer_simulator_from(fake_perth) | None | None | None | None | None | None | None | None |
| 5bba5833 | state | StateTomography | [Q1] | DensityMatrix([[0.84277344+0.j , 0.0214... | None | aer_simulator_from(fake_perth) | None | 1.0 | [0.9777027933781316, 0.022297206621869486] | [0.9777027933781316, 0.022297206621869486] | False | {'fitter': 'linear_inversion', 'fitter_time': ... | 1.0 | True |
| 3cb4395f | state_fidelity | StateTomography | [Q1] | 0.977159 | None | aer_simulator_from(fake_perth) | None | None | None | None | None | None | None | None |
| 7e2c3047 | positive | StateTomography | [Q1] | True | None | aer_simulator_from(fake_perth) | None | None | None | None | None | None | None | None |
| 3e4c2338 | state | StateTomography | [Q2] | DensityMatrix([[ 0.49707031+0.j , -0.01... | None | aer_simulator_from(fake_perth) | None | 1.0 | [0.9660301135897351, 0.033969886410265826] | [0.9660301135897351, 0.033969886410265826] | False | {'fitter': 'linear_inversion', 'fitter_time': ... | 1.0 | True |
| 6c32ef14 | state_fidelity | StateTomography | [Q2] | 0.96582 | None | aer_simulator_from(fake_perth) | None | None | None | None | None | None | None | None |
| 670033c1 | positive | StateTomography | [Q2] | True | None | aer_simulator_from(fake_perth) | None | None | None | None | None | None | None | None |
| c8dacaa3 | state | StateTomography | [Q3] | DensityMatrix([[ 0.15917969+0.j , -0.01... | None | aer_simulator_from(fake_perth) | None | 1.0 | [0.9726219480063372, 0.027378051993663707] | [0.9726219480063372, 0.027378051993663707] | False | {'fitter': 'linear_inversion', 'fitter_time': ... | 1.0 | True |
| 8d00b9d5 | state_fidelity | StateTomography | [Q3] | 0.972325 | None | aer_simulator_from(fake_perth) | None | None | None | None | None | None | None | None |
| e522f416 | positive | StateTomography | [Q3] | True | None | aer_simulator_from(fake_perth) | None | None | None | None | None | None | None | None |
| ca3668bf | state | StateTomography | [Q4] | DensityMatrix([[ 0.04492188+0.j , -0.01367... | None | aer_simulator_from(fake_perth) | None | 1.0 | [0.9563546674676742, 0.043645332532327025] | [0.9563546674676742, 0.043645332532327025] | False | {'fitter': 'linear_inversion', 'fitter_time': ... | 1.0 | True |
| 81b5faa3 | state_fidelity | StateTomography | [Q4] | 0.955078 | None | aer_simulator_from(fake_perth) | None | None | None | None | None | None | None | None |
| 3ba8d890 | positive | StateTomography | [Q4] | True | None | aer_simulator_from(fake_perth) | None | None | None | None | None | None | None | None |
View experiment analysis results for one component:
results = pardata.analysis_results(dataframe=True)
display(results[results.components.apply(lambda x: x == ["Q0"])])
| name | experiment | components | value | quality | backend | run_time | trace | eigvals | raw_eigvals | rescaled_psd | fitter_metadata | conditional_probability | positive | |
|---|---|---|---|---|---|---|---|---|---|---|---|---|---|---|
| 2aa691b6 | state | StateTomography | [Q0] | DensityMatrix([[0.97460938+0.j , 0.0078... | None | aer_simulator_from(fake_perth) | None | 1.0 | [0.974677689270737, 0.02532231072926413] | [0.974677689270737, 0.02532231072926413] | False | {'fitter': 'linear_inversion', 'fitter_time': ... | 1.0 | True |
| 32b73955 | state_fidelity | StateTomography | [Q0] | 0.974609 | None | aer_simulator_from(fake_perth) | None | None | None | None | None | None | None | None |
| 14d21b87 | positive | StateTomography | [Q0] | True | None | aer_simulator_from(fake_perth) | None | None | None | None | None | None | None | None |
References
See also
API documentation:
StateTomography